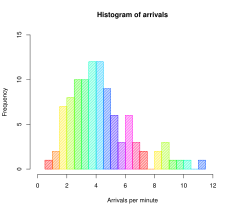
Histograms are designed to show distribution of data in a way that makes it easy for people to compare visually. This histogram shows the frequency and arrivals per minute. For example at 6 arrivals per minute there was a frequency of about a 6 or 7.
No comments:
Post a Comment