http://upload.wikimedia.org/wikipedia/commons/thumb/0/0f/Oldfaithful3.png/240px-Oldfaithful3.png
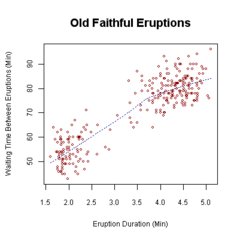
Scatterplots display values for a set of two variables for a set of data. This is a scatterplot of two Old Faithful eruptions. It shows how many minutes are in between the two eruptions and the eruption duration.

No comments:
Post a Comment